
A report written for the integrative work-up.
This is the Oral Balance Test read for functional, integrative and longevity practices: the same saliva sample and scoring as the patient report, with percentiles against our reference set, the trend since the last test, systemic research associations next to the markers they sit beside, and conditional considerations. It adds to the other Oral Balance reports rather than replacing them. The patient is fictitious; the layout and logic are the report's own.
The PDF opens in a new tab. Nothing on this page is a real patient's result.
What the report shows
-
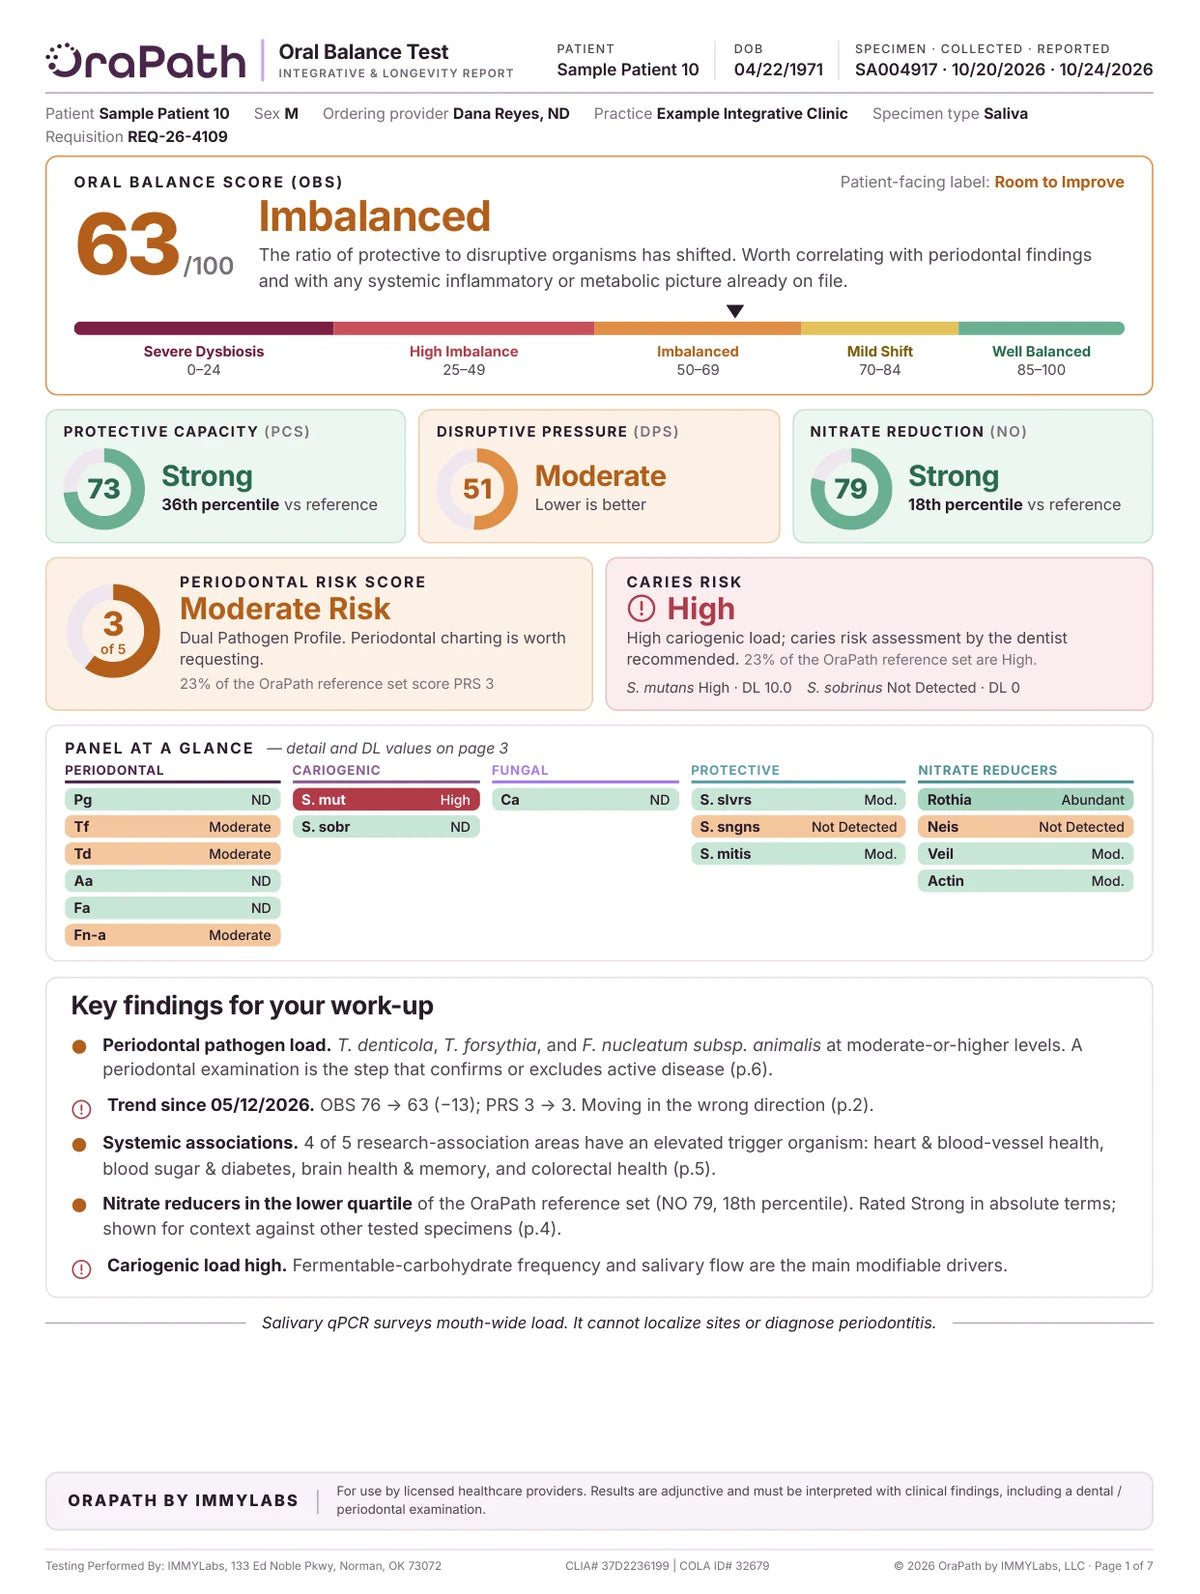
The score, the risk findings and the key findings for your work-up -
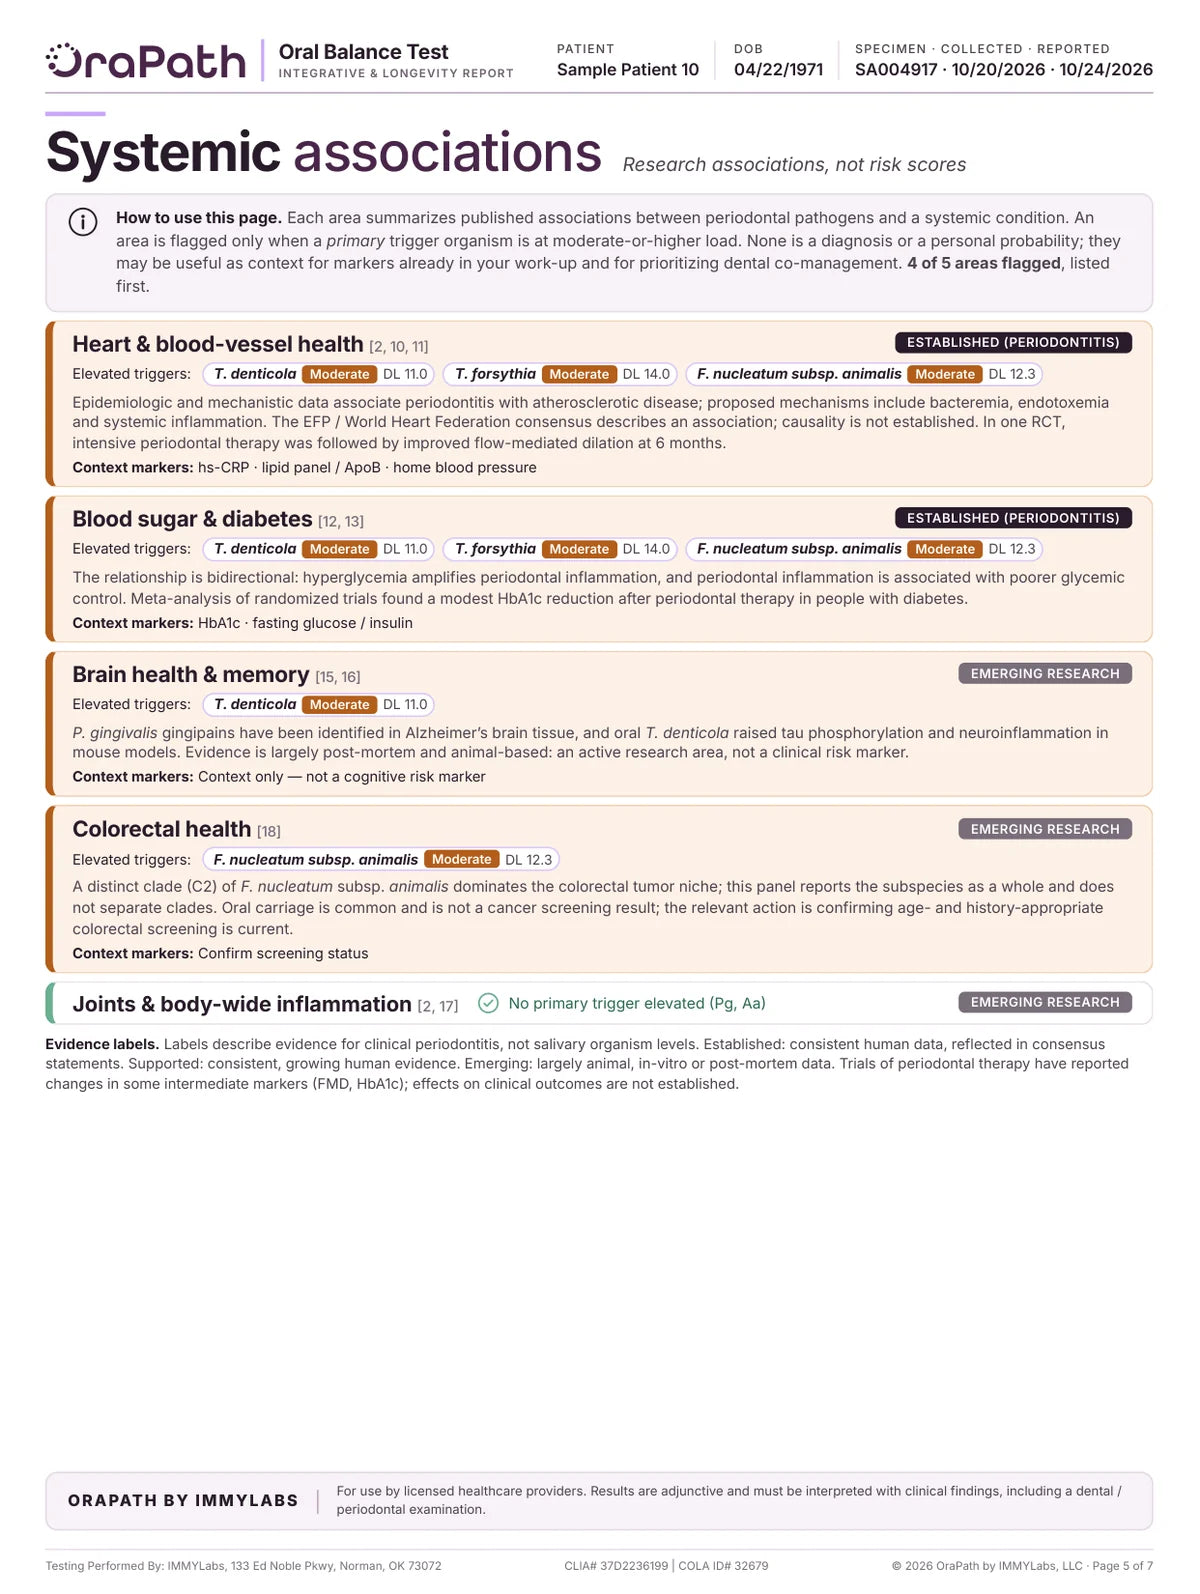
Systemic associations, flagged only when a trigger organism is elevated -
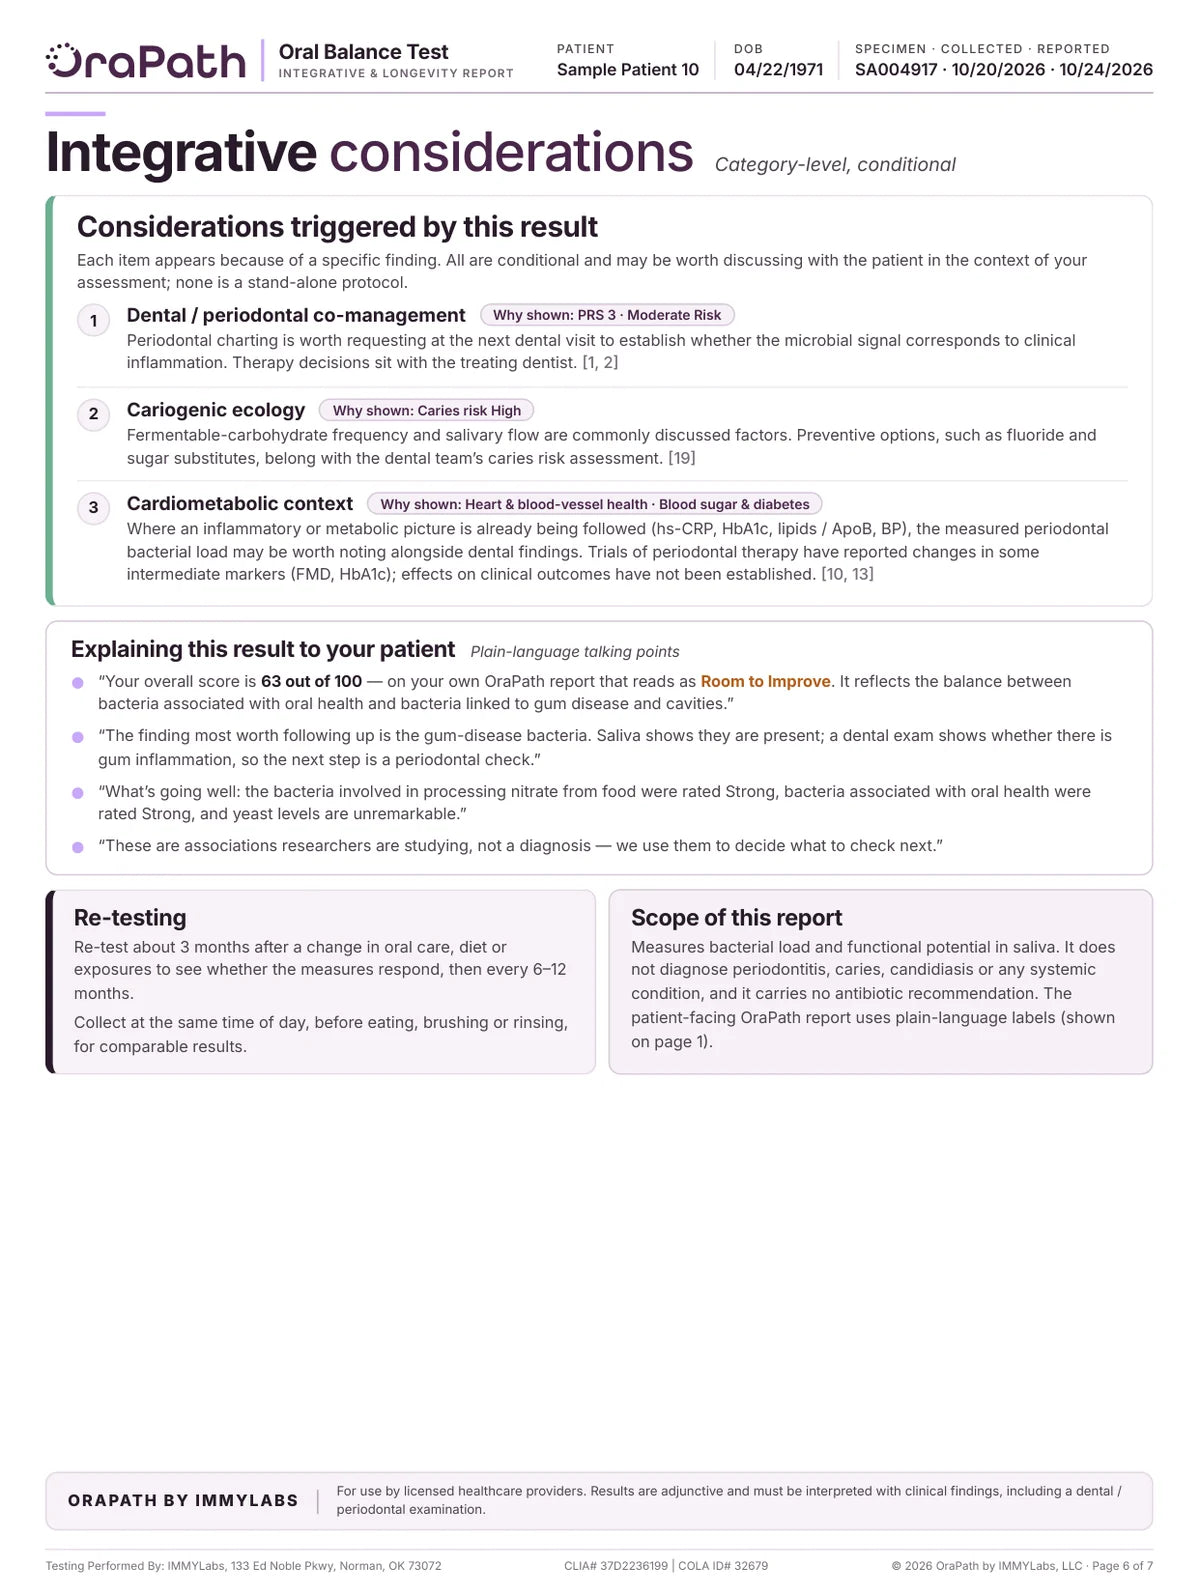
Conditional considerations and patient talking points
The whole result, ranked for the work-up
What did the test find, and what matters first?
The report opens on the Oral Balance Score: 63 of 100, Imbalanced, in this sample, shown next to the label the patient sees on their own report (Room to Improve). Below it sit the three component scores, each with its percentile against the OraPath reference set, then the Periodontal Risk Score, caries risk and all sixteen organisms at a glance. The page closes with five key findings for your work-up, each pointing to the page that explains it.
What to look at
- The clinical label and the patient-facing label, side by side
- Protective Capacity, Disruptive Pressure and Nitrate Reduction, with percentiles against the reference set
- Periodontal Risk Score and caries risk, each with how common it is in the reference set
- Key findings, each with a page reference

What changed since the last test
Is it moving in the right direction?
This sample has one prior test, 161 days earlier, so page 2 compares the two. Every score and all sixteen organisms are shown prior against now, with the change in detection level, the approximate fold change and a direction. Here the Oral Balance Score fell from 76 to 63 and S. mutans rose about 550-fold, while F. nucleatum subsp. animalis fell. Changes under 2 detection levels (about 4×) or 5 score points are labeled Stable, so collection-day noise isn't read as a trend.
What to look at
- Every score, prior against now, with a direction
- Each organism's change in detection level and approximate fold change
- A Stable threshold, so small shifts aren't over-read
- OraPath repeat-test data for context, labeled as observational

All sixteen organisms, with the biology
What exactly was measured?
Sixteen qPCR targets in five groups: periodontal pathogens, cariogenic streptococci, Candida, protective commensals and nitrate reducers. Each organism gets a tier, its detection level and one line on the biology most relevant to a systemic work-up, and each group states which direction is favorable. A note at the foot explains the scale: detection level is 40 minus Ct, so each step up is roughly a doubling of target copies.
What to look at
- Five groups, each with its favorable direction
- A tier and a detection level for every organism
- One line of biology per organism
- How to read detection levels: logarithmic, about 2× per step

Nitric oxide and resilience
What is the mouth contributing, not just harboring?
The two health-associated functions on the panel get their own page. Nitrate reduction is laid out as the enterosalivary pathway in four steps, with each nitrate-reducing genus and its percentile, followed by protective capacity. Both are placed against the OraPath reference set of 283 specimens, and the page says so when the two views differ: here nitrate reduction is rated Strong in absolute terms but sits at the 18th percentile. It reports genetic capacity only; activity is not measured.
What to look at
- Dietary nitrate to nitrite to nitric oxide, step by step
- Each nitrate reducer with its own percentile
- Key evidence and clinical relevance, with citations
- The absolute rating and the reference-set percentile, side by side
Systemic associations, with the evidence labeled
How does this connect to the rest of the work-up?
Five areas: heart and blood-vessel health, blood sugar and diabetes, brain health and memory, colorectal health, and joints and body-wide inflammation. An area is flagged only when a primary trigger organism is at a moderate or higher load, and flagged areas come first. Each names the organisms behind it, carries an evidence label and lists context markers you may already be following, such as hs-CRP, ApoB or HbA1c. These are associations reported in research, not a diagnosis and not a personal risk score.
What to look at
- Flagged only when a primary trigger organism is moderate or higher
- Established or emerging research, labeled on each area
- Context markers that sit beside labs already in your work-up
- Areas that weren't flagged are still listed
Considerations, and how to explain them
What do I do with this, and what do I tell the patient?
Each consideration on this page appears because of a specific finding and says which one: here, the Periodontal Risk Score, the caries risk and the two cardiometabolic associations. All are conditional and category-level, not a protocol, and periodontal co-management comes first. Under them are plain-language talking points for the visit, when to re-test and how to collect for a comparable result, and the report's scope: it measures bacterial load and functional potential, and it diagnoses nothing.
What to look at
- Every consideration shows why it appears
- Periodontal co-management first
- Talking points in plain language, ready for the visit
- When to re-test, and how to collect for a comparable result

Methods and references
How are the scores built?
The last page shows the working: the score bands with their clinical and patient labels, the thresholds for each measure, detection-level cutpoints by organism, how each score is calculated, and the twenty numbered references cited through the report. Percentiles compare against the OraPath reference set, a comparison group of tested specimens rather than a healthy-normal range, and the page says so.
What to look at
- Clinical and patient labels for every score band
- Detection-level cutpoints for each organism group
- How the Oral Balance, protective, disruptive, nitrate and periodontal scores are built
- Twenty numbered references
The Oral Balance Test is a laboratory-developed test performed by IMMYLabs (CLIA #37D2236199; COLA #32679), validated under CLIA, 42 U.S.C. § 263a. It has not been cleared or approved by the U.S. Food and Drug Administration. Results are semi-quantitative, describe a pooled saliva sample rather than any tooth or site, and are adjunctive: they are interpreted with clinical findings, including a periodontal examination. Integrative considerations are general, category-level information, not individualized treatment recommendations.